|
Getting your Trinity Audio player ready...
|
Observability tool sprawl leads to fragmented visibility, higher operational cost, and delayed decision-making during incidents across enterprise environments, according to Gartner. Monitoring environments rarely stay simple for long. Each new tool often enters an organization with a specific purpose, such as closing a visibility gap, tracking a new microservice, or adding deeper analytics capability. Over time, these tools accumulate independently and create overlapping dashboards, repeated metrics across systems, and alert noise that slows response during incidents.
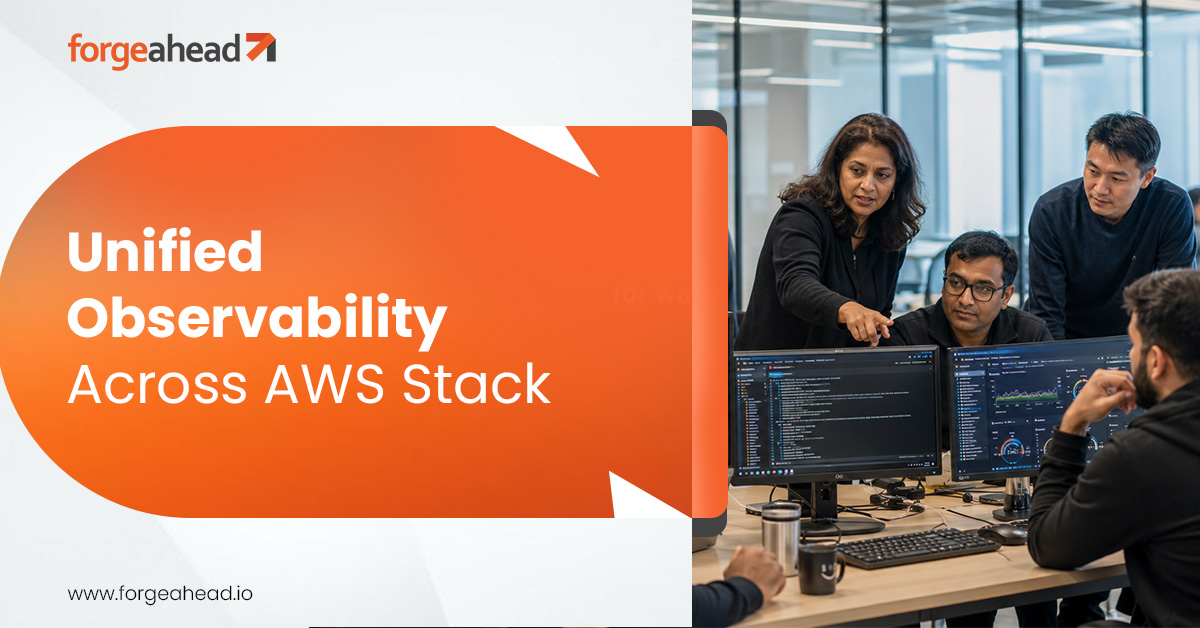
As this expands, teams end up moving between multiple platforms to understand a single issue, which increases the time spent on correlation instead of resolution. Observability setups often grow faster than the systems they monitor, and that imbalance introduces the “swivel-chair” pattern where context is constantly rebuilt across tools. Building a unified AWS observability stack through consolidation of monitoring tools becomes essential to reduce this operational overhead, maintain consistent system understanding at scale, and improve cloud reliability.
How Fragmented Monitoring Tools Impact Observability
Tool sprawl usually grows through individual decisions made across different groups rather than a single coordinated plan. Each group selects platforms based on immediate requirements, and over time those choices begin to overlap in how they handle telemetry, alerts, and system visibility.
- Redundant ingestion: The same telemetry data gets sent to multiple collectors, which increases storage load and raises costs without improving insight quality.
- Conflicting alerts: Multiple tools trigger notifications for the same event, often with different thresholds, which makes it harder to decide which signal needs attention first.
- Manual correlation: Logs, metrics, and traces remain spread across separate platforms, so engineers spend time connecting signals during incidents instead of focusing on resolution.
Observability gradually stops functioning as a single view of system behavior and becomes a process that depends on constant signal reconciliation during operational events.
Why Running Multiple Monitoring Tools Becomes Expensive
Costs from tool fragmentation extend well beyond overlapping software subscriptions and show up across both infrastructure usage and day-to-day operations.
- Infrastructure and ingestion waste: Multiple ingestion pipelines and duplicated storage systems process similar telemetry data across tools, increasing cloud spend without adding additional visibility.
- Operational drag: During incidents, context switching becomes unavoidable as engineers move between platforms, query different systems, and manually connect signals across separate interfaces.
- Reliability risk: Slower incident resolution leads to longer outages, which increases impact on users and raises overall system risk during critical events.
As observability layers expand without coordination, operational overhead grows quickly. Efforts such as replacing Datadog Prometheus with AWS CloudWatch or similar consolidation approaches often reduce complexity and lower total cost of ownership by bringing telemetry under a single AWS-native model.
What a Unified AWS-Native Observability Stack Looks Like
A unified AWS-native approach simplifies observability by bringing metrics, logs, and traces into a single platform, allowing system signals to connect naturally instead of being manually stitched across multiple tools.
| Capability | Multi-tool Setup | Unified AWS-Native Setup |
| Metrics | Separate, siloed tools | CloudWatch Metrics |
| Logs | Fragmented external tools | CloudWatch Logs |
| Traces | Dedicated, external APM tools | X-Ray integrated tracing |
| Alerts | Multiple, disconnected systems | Centralized CloudWatch Alarms |
How to Replace Multiple Monitoring Tools With a Unified AWS-Native Observability Stack in 2026
Consolidation works best when it follows a structured sequence that preserves visibility while reducing reliance on multiple monitoring tools.
Step 1 – Map telemetry sources
Review all observability tools to identify where metrics, logs, and traces are generated and how they move across systems.
Step 2 – Define the AWS-native baseline
Establish CloudWatch as the primary observability layer and configure the OpenTelemetry ADOT collector as the standard ingestion mechanism.
Step 3 – Gradual migration
Transition one service area at a time while running the AWS-native setup alongside existing tools to validate consistency in alerts and dashboards.
Step 4 – Standardize alerting
Align threshold logic across systems and use alarm mute rules during maintenance windows to reduce unnecessary alert noise.
Step 5 – Decommission
Retire redundant tools after validation confirms that the AWS-native setup delivers equivalent or better visibility.
How Does Observability Improve After Tool Consolidation
Consolidation improves how monitoring data is used across daily operations. As a result, incident correlation becomes faster since metrics, logs, and traces are available in a shared environment instead of spread across multiple tools. At the same time, alert noise reduces as overlapping thresholds are aligned and duplicate notifications are removed.
Monitoring costs also become more stable as ingestion pipelines are streamlined and redundant data processing is reduced. Over time, attention moves away from managing multiple tools and toward understanding how systems behave under different conditions.
How Forgeahead Helps With Observability Consolidation
Forgeahead supports the design of unified observability systems built on AWS-native services that reduce reliance on multiple monitoring tools and improve how telemetry is managed across environments.
- Standardization: Overlapping monitoring setups are replaced with CloudWatch-centered systems, and telemetry pipelines are aligned for consistent data flow.
- Modernization: Observability layers are restructured using AWS Well-Architected principles to improve reliability, visibility, and operational consistency.
- Agentic AI accelerators: Agentic AI supports log correlation, helps set up anomaly detection, and validates migration accuracy during consolidation efforts.
These changes simplify operational workflows, reduce monitoring overhead, and maintain consistent system visibility across the environment.
Ready to streamline your observability? Partner with Forgeahead to build a unified, cloud-native monitoring foundation.
Frequently Asked Questions
1. Is CloudWatch really enough to replace high-end APM tools?
Yes, for AWS-native workloads, CloudWatch with X-Ray and Application Signals provides equivalent visibility without added vendor cost.
2. How do I manage the cost of CloudWatch logs and custom metrics?
Limit unnecessary ingestion, use log tiers for low priority data, and rely on OpenTelemetry standards to control custom metric costs.
3. Does consolidation require a complete rewrite of my instrumentation?
No, OpenTelemetry via ADOT allows backend changes without modifying application-level instrumentation.
4. How does AI help in observability consolidation?
AI maps logs to traces, recommends alert thresholds, and identifies unused or redundant telemetry streams.
5. What is the biggest risk during consolidation?
Loss of visibility is the main risk, which is managed by running legacy and AWS-native systems in parallel during migration.